You can use Trellix’s ePolicy Orchestrator (ePO) to monitor the machines in your institution using custom queries and filters. You create queries for different criteria you’re interested in tracking. This could include OS versions build numbers and even machines that haven’t communicated with the service recently
You can use these reports to investigate machines using unsupported versions of Windows and in need of upgrades. You could also use the ePO to create an inventory of devices in your institution if you do not already have one.
You can do this in several ways:
- Add columns to your system tree view. This is less useful if you already have a lot of columns.
- Create custom filters for the system tree view. You can re-run these filters when needed.
- Create custom queries. This allows you to export a report in different file formats.
For more information or help using the service, please contact anti-malware@uis.cam.ac.uk.
Add columns to your system tree view
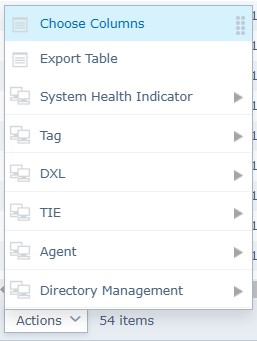
- Click the ‘Actions’ button. From the expanded menu select ‘Choose Columns’.
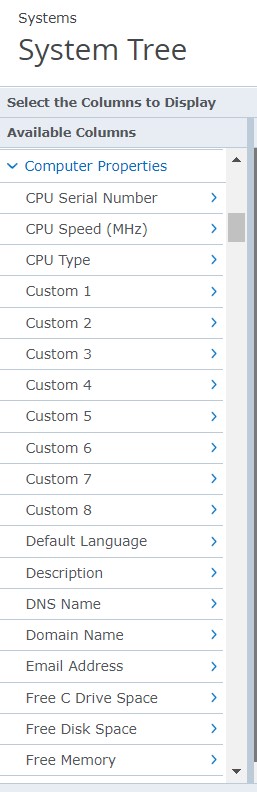
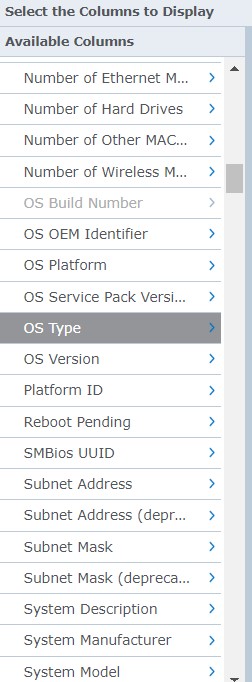
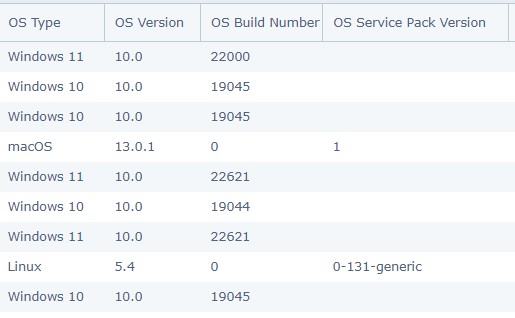
- Select additional columns to add to your System Tree view:
- OS Type
- OS Version
- OS Build Number
- OS Service Pack Version
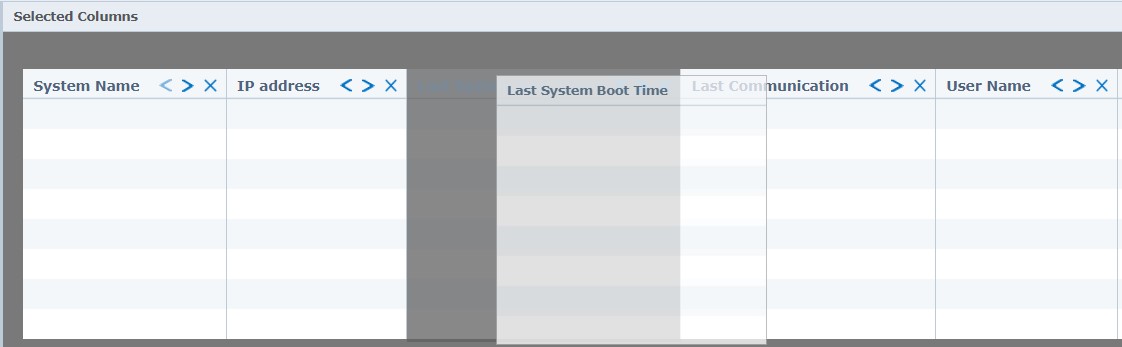
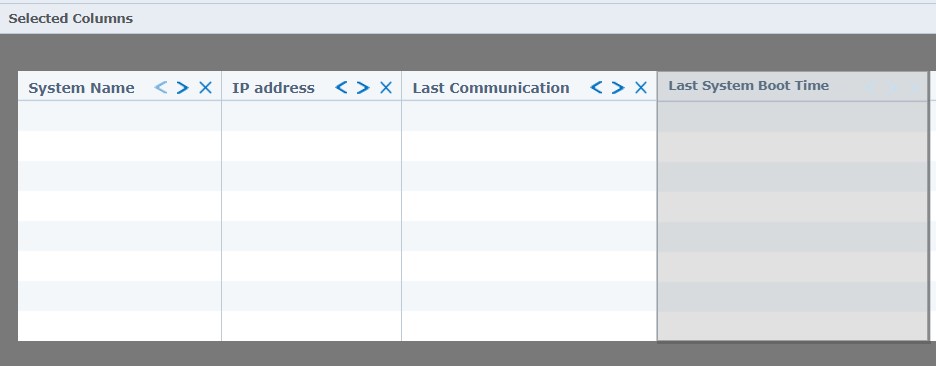
- Arrange the columns by dragging them or using the left and right arrows.
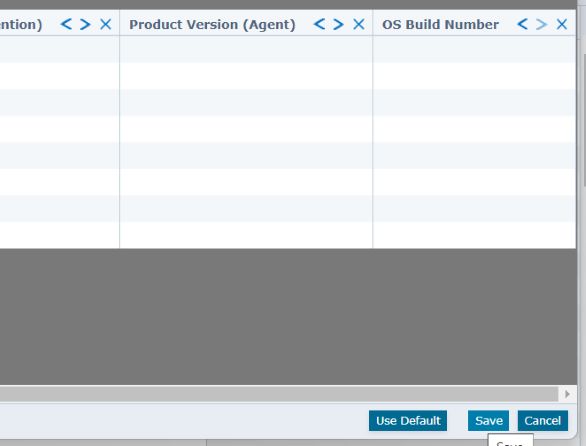
- Save your new column view.
- Your new columns will now display.
Custom filters can be created and saved for the system tree view
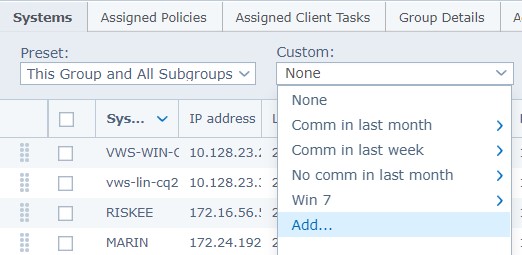
- In the ‘System Tree’ view, click to expand the dropdown under ‘Custom’. Select ‘Add…’.
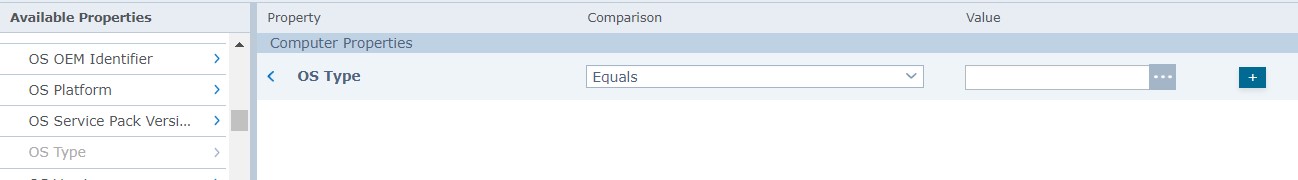
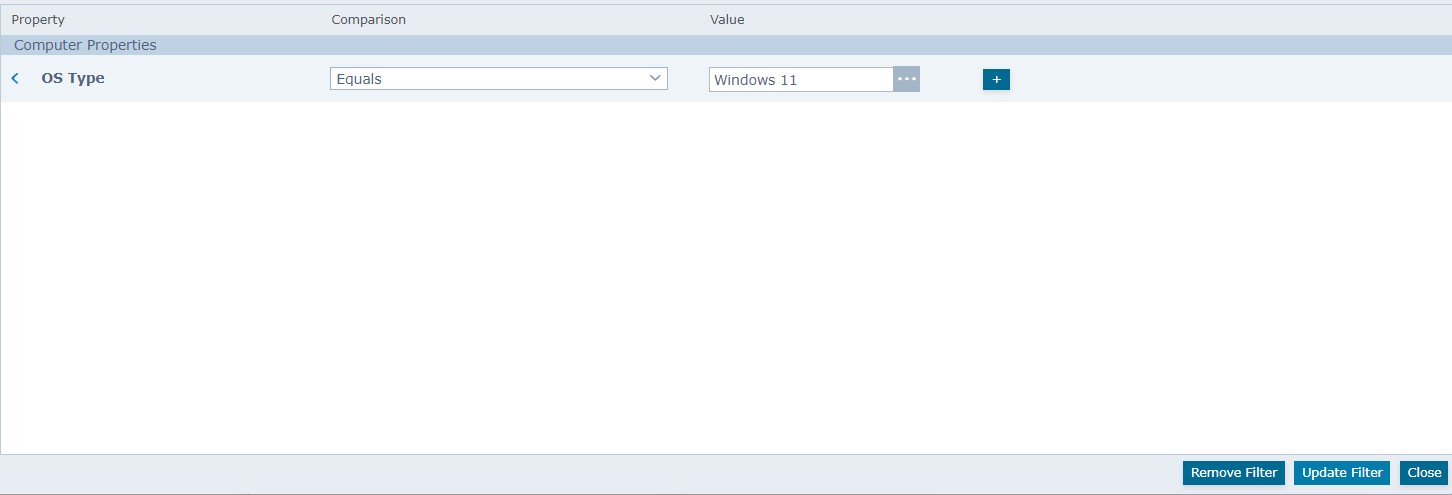
- Select the required properties from the ‘Available Properties’ menu. For example, OS Type. Select an ‘Existing Value’ for the comparisons by clicking on the three dots.
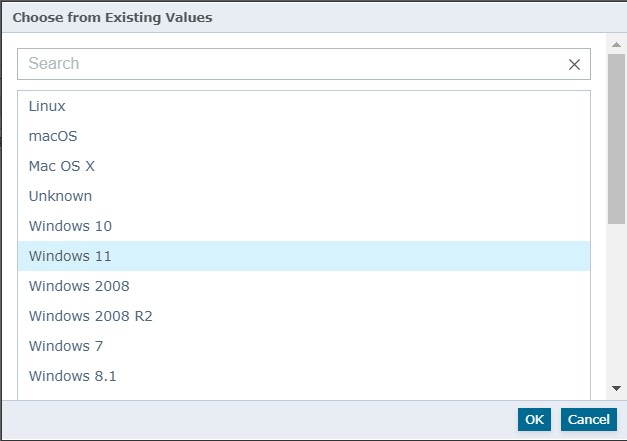
- Select the relevant OS type from the dropdown menu. Click ’OK’.
- Click ‘Update Filter’.
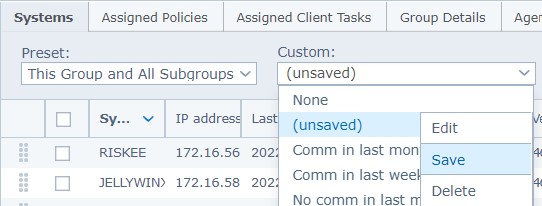
- The filter will show as ‘(unsaved)’ within the ‘Custom’ dropdown. Click the dropdown and select ‘Save’ to name it.
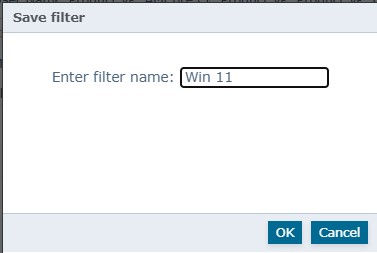
- Add a meaningful filter name. For example, ‘Win 11’. Click ‘OK’.
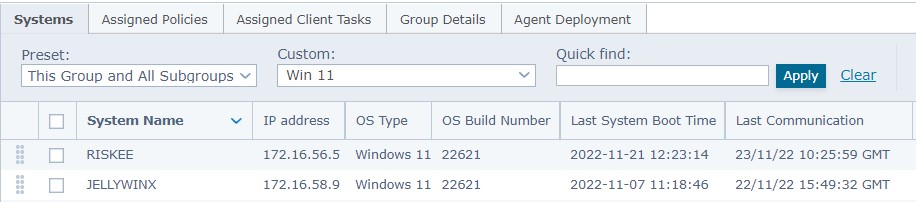
- The filter is now available to use as required.
Custom queries can be created and saved
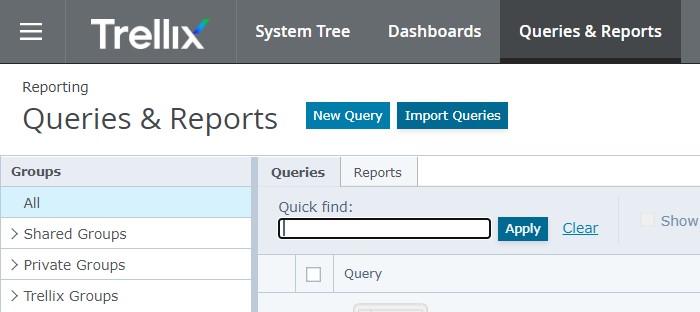
- Select the ‘Queries & Reports’ tab and click the ‘New Query’ button.
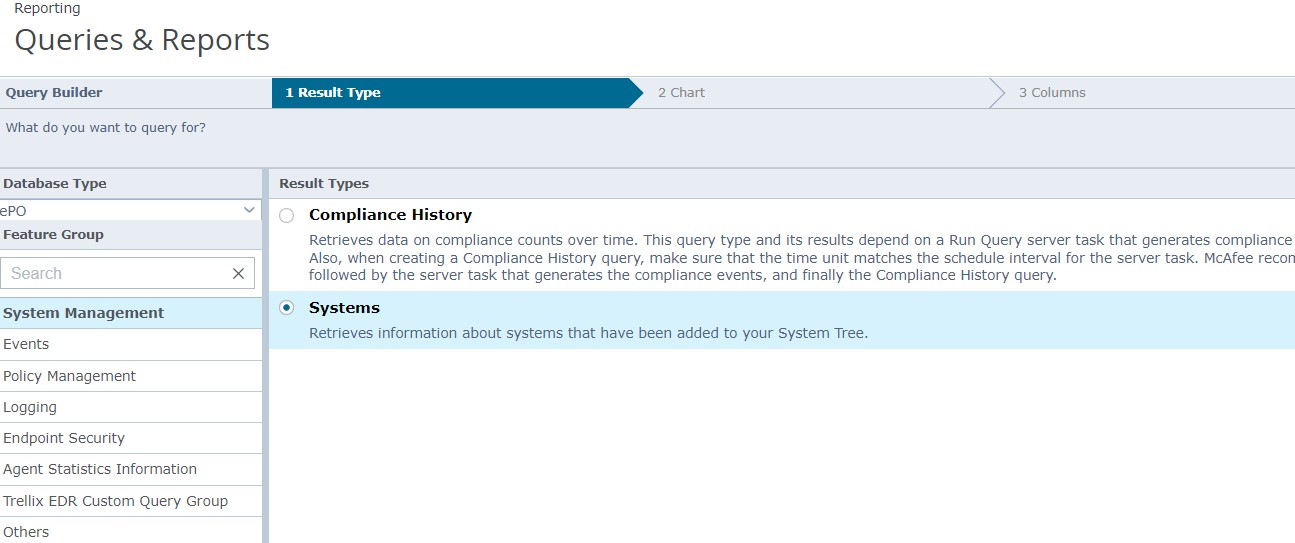
- Select ‘System Management’ from the ‘Feature Group’ menu. Select ‘Systems’ on the ‘Result Type’ tab.
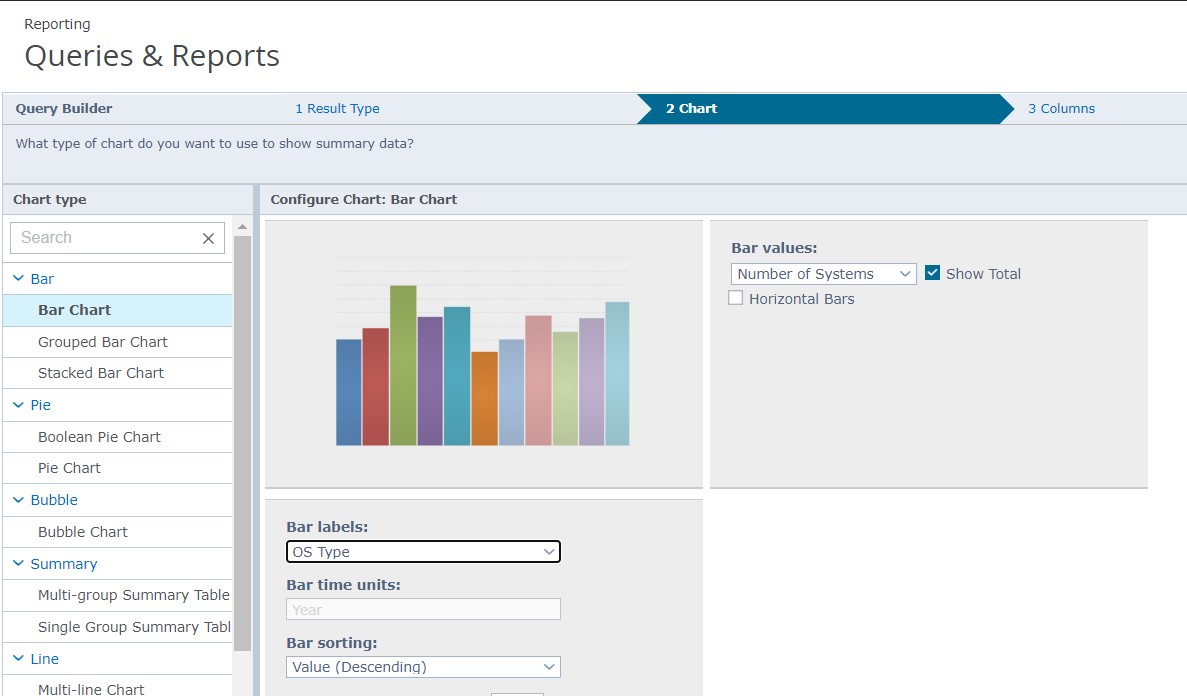
- Select the required chart type, bar labels and bar values. For example, you can select a bar chart with ‘OS Type’ as the bar labels and ‘Number of Systems’ as the bar values.
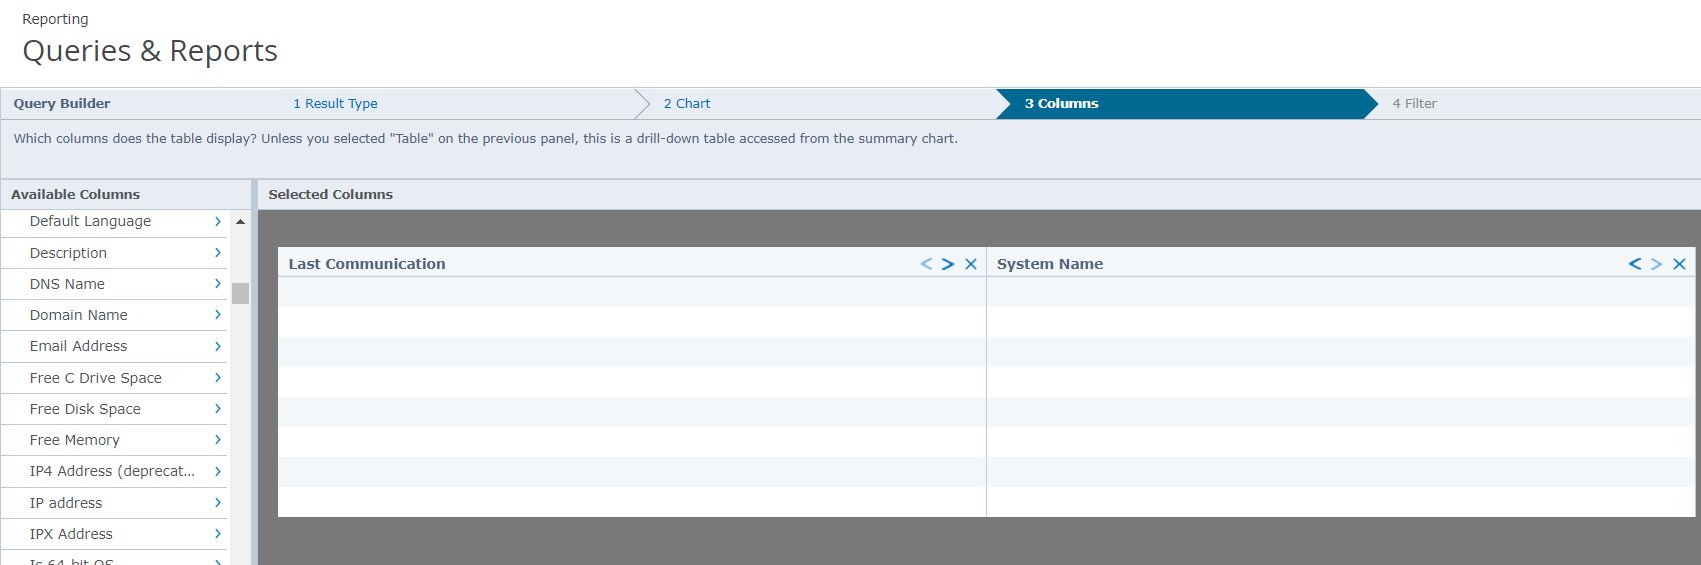
- Select any additional columns you’re interested in from the ‘Available Columns’ menu. For example, ‘Last Communication’.
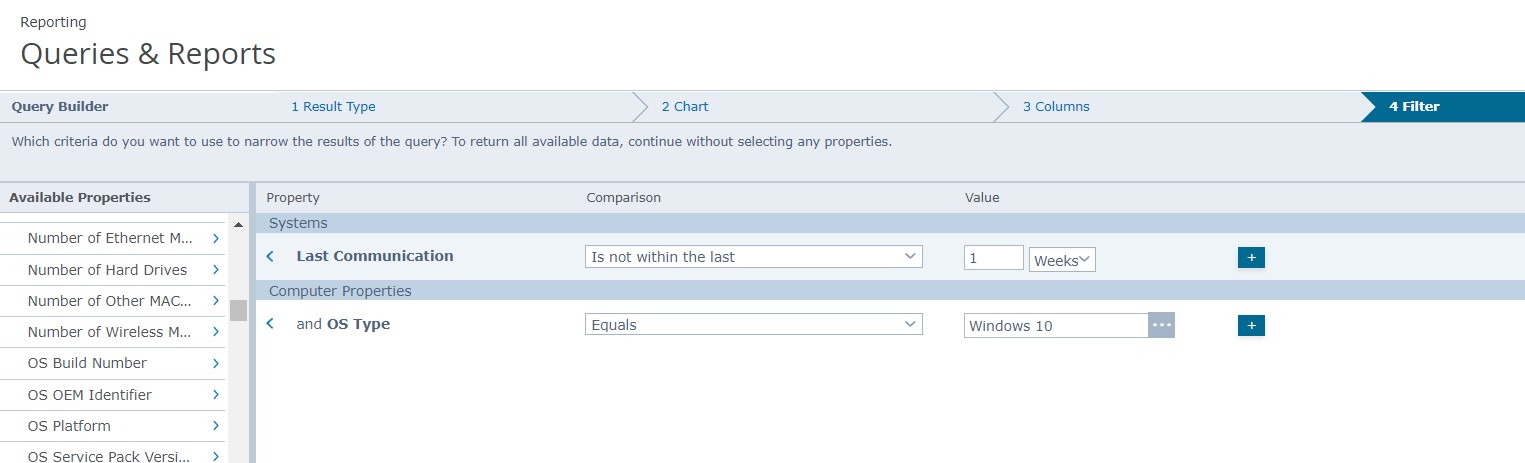
- Select the required filter options. For example, you can create a query that only returns Windows 10 machines. Or you could select machines that have not communicated with the service in the last week. If filters are not added, all systems will display.
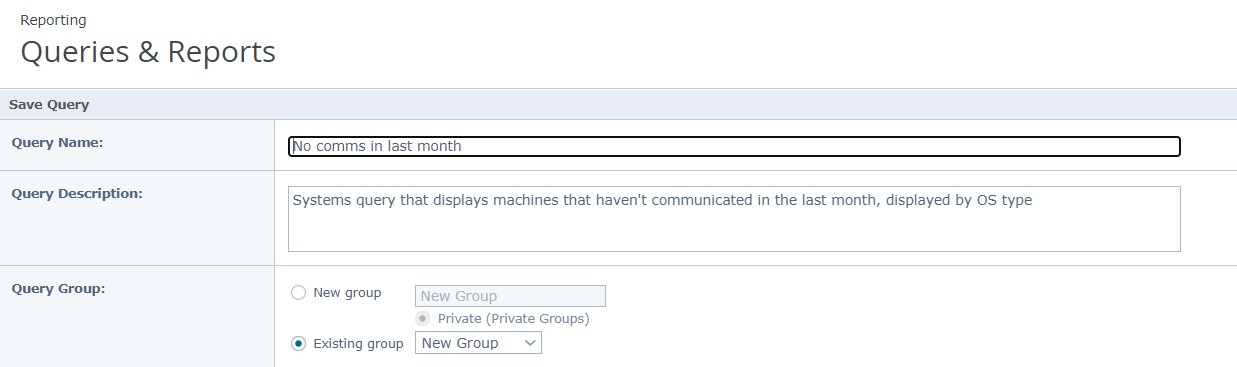
- Save the query, giving it a meaningful name. You can also add a description.
- Run the query and check it displays as expected. You can edit queries following the same steps.
- Export the report file if needed. You can choose between the following file formats:
- csv
- html
- xhtml